|
There were six independent leagues that played full seasons in 2015, but one of them, the eight-team Pecos League, did not release attendance numbers. The five indy leagues that did had a combined 44 teams that collectively had tickets sales of 6,256,736 for 2,243 regular season game dates.
Just like it is for affiliated minor league baseball teams, attendance figures for independent league teams are based on tickets sold and averages are computed based on dates, not games (the difference between the two is explained here).
Attendance totals and dates are from league websites, while ballpark information is from Baseball Pilgrimages' 2015 Ballpark Directory.
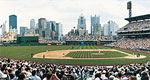
American Association
2,007,357 tickets sold by 13 teams for 625 games (3,212 average)
| Team | Total | Dates | Average | Ballpark (Capacity) |
| St. Paul Saints | 404,528 | 50 | 8,091 | CHS Field (7,000) |
| Winnipeg Goldeyes | 258,922 | 49 | 5,284 | Shaw Park (7,481) |
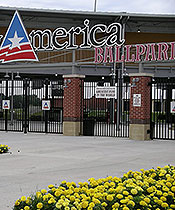
| Kansas City T-Bones | 232,068 | 47 | 4,938 | CommunityAmerica Ballpark (6,537) |
| Fargo-Moorhead RedHawks | 187,099 | 50 | 3,742 | Newman Outdoor Field (4,513) |
| Gary SouthShore RailCats | 165,306 | 47 | 3,517 | U.S. Steel Yard (6,139) |
| Lincoln Saltdogs | 171,605 | 50 | 3,432 | Haymarket Park (4,500) |
| Wichita Wingnuts | 141,837 | 49 | 2,895 | Lawrence-Dumont Stadium (6,111) |
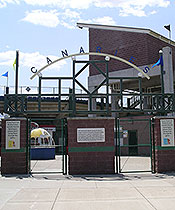
| Sioux Falls Canaries | 132,280 | 47 | 2,814 | Sioux Falls Stadium (4,462) |
| Sioux City Explorers | 77,429 | 47 | 1,647 | Lewis & Clark Park (3,630) |
| Joplin Blasters | 69,222 | 45 | 1,538 | Joe Becker Stadium (4,200) |
| Laredo Lemurs | 62,517 | 48 | 1,302 | Uni-Trade Stadium (6,000) |
| Grand Prairie AirHogs | 52,072 | 47 | 1,108 | QuikTrip Park (5,445) |
| Amarillo Thunderheads | 52,472 | 49 | 1,071 | Potter County Stadium (8,500) |
Atlantic League
2,176,627 tickets sold by 8 teams for 535 games (4,068 average)
| Team | Total | Dates | Average | Ballpark (Capacity) |
| Long Island Ducks | 358,317 | 68 | 5,269 | Bethpage Ballpark (6,002) |
| Somerset Patriots | 347,770 | 67 | 5,191 | TD Bank Ballpark (6,100) |
| Sugar Land Skeeters | 301,860 | 68 | 4,439 | Constellation Field (7,500) |
| Lancaster Barnstormers | 276,975 | 68 | 4,073 | Clipper Magazine Stadium (6,000) |
| York Revolution | 259,989 | 68 | 3,823 | Santander Stadium (7,312) |
| Southern Maryland Blue Crabs | 222,611 | 62 | 3,591 | Regency Furniture Stadium (6,000) |
| Camden Riversharks | 216,639 | 68 | 3,186 | Campbells Field (6,425) |
| Bridgeport Bluefish | 192,466 | 66 | 2,916 | The Ballpark at Harbor Yard (5,300) |
Can-Am League
641,084 tickets sold by 6 teams for 306 games (2,095 average)
| Team | Total | Dates | Average | Ballpark (Capacity) |
| Rockland Boulders | 161,796 | 53 | 3,053 | Provident Bank Park (4,750) |
| Quebec Capitales | 130,510 | 51 | 2,559 | Stade Municipal (4,800) |
| Ottawa Champions | 115,880 | 52 | 2,228 | RCGT Park (10,332) |
| Trois-Rivieres Aigles | 96,997 | 52 | 1,865 | Stade Fernand-Bédard (4,500) |
| New Jersey Jackals | 78,913 | 50 | 1,578 | Yogi Berra Stadium (3,784) |
| Sussex County Miners | 56,988 | 48 | 1,187 | Skylands Stadium (4,200) |
Frontier League
1,394,584 tickets sold by 13 teams for 623 games (2,238 average)
| Team | Total | Dates | Average | Ballpark (Capacity) |
| Schaumburg Boomers | 162,210 | 53 | 3,061 | Boomers Stadium (7,365) |
| Gateway Grizzlies | 149,319 | 51 | 2,928 | GCS Ballpark (5,500) |
| Traverse City Beach Bums | 132,404 | 46 | 2,878 | Wuerfel Park (4,600) |
| Southern Illinois Miners | 151,503 | 53 | 2,859 | Rent One Park (4,500) |
| Evansville Otters | 114,787 | 42 | 2,733 | Bosse Field (5,110) |
| Florence Freedom | 104,578 | 46 | 2,273 | UC Health Stadium (4,200) |
| Normal CornBelters | 102,290 | 49 | 2,088 | The Corn Crib (7,000) |
| Joliet Slammers | 95,673 | 47 | 2,036 | Silver Cross Field (6,229) |
| River City Rascals | 91,354 | 48 | 1,903 | T.R. Hughes Ballpark (4,989) |
| Washington Wild Things | 83,087 | 46 | 1,806 | CONSOL Energy Park (3,200) |
| Lake Erie Crushers | 86,155 | 48 | 1,795 | All Pro Freight Stadium (5,000) |
| Windy City ThunderBolts | 76,550 | 49 | 1,562 | Standard Bank Stadium (3,042) |
| Rockford Aviators | 44,674 | 45 | 993 | Aviators Stadium (3,279) |
Pacific Association
37,084 tickets sold by 4 teams for 154 games (241 average)
| Team | Total | Dates | Average | Ballpark (Capacity) |
| San Rafael Pacifics | 20,610 | 38 | 542 | Albert Park (1,200) |
| Vallejo Admirals | 6,776 | 39 | 174 | Wilson Park (500) |
| Sonoma Stompers | 5,760 | 38 | 152 | Arnold Field (1,450) |
| Pittsburg Diamonds | 3,938 | 39 | 101 | City Park Field #1 (400) |
|
|
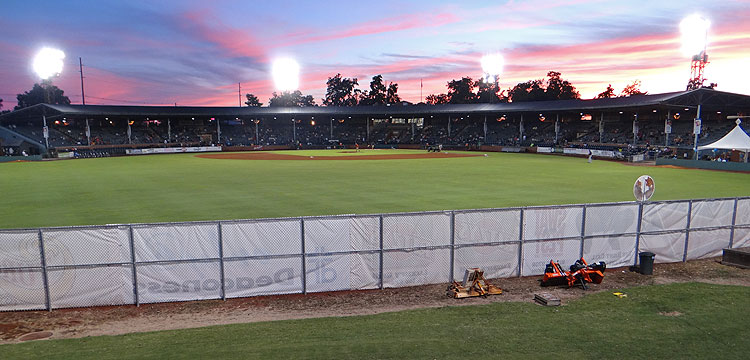
Evansville's Bosse Field turned 100 years old in 2015, when the longest-tenured team (Evansville Otters) in the oldest currently operating independent league (Frontier League) played their 21st season in the 5,110-seat ballpark, which is the oldest at any level of minor league baseball. The Otters averaged 2,733 fans for their 42 home dates in 2015 and drew 4,058 for their game on June 17, which was played 100 years to the day that Bosse Field opened before an overflow crowd of 8,082. |