|
Total attendance for Major League Baseball in 2015 was 73,760,020.
It's important to note that attendance numbers are based on tickets sold, not tickets actually used. Because the tally is not based on the turnstile count, the total and average attendance reported by each team at their ballpark does not accurately reflect the number of people who actually attended games.
Also, averages are computed by dividing the total by "dates," a designation that is used instead of "games" since not all teams, due to doubleheaders and occasional other reasons, have 81 game dates in a season (in 2015, 23 of 30 teams did).
There were 12 single-admission doubleheaders in 2015 and the Tigers and Indians failed to make up one postponed game in Cleveland, so the total number of home dates (2,417) for all 30 major league ballparks was 13 less than the possible 2,430.
The average number of tickets sold per date in the 2015 season was 30,517. All games were played in the normal 30 MLB ballparks, unlike in 2014 when two games were played in Australia, but the Orioles did play three "home" games at Tropicana Field in May against the Rays after civil unrest (rioting) in Baltimore resulted in a series being moved to St. Petersburg, where the Orioles received the gate from the 39,386 tickets sold. For that three-game series, only the lower level of Tropicana Field was open and all seating in it was general admission.
The Orioles also played a home game at Camden Yards that was closed to the public on April 29, resulting in baseball's first recorded game attendance of 0. Safety concerns caused by riots in Baltimore were the reason for the "fanless game," which did not count as a date for purposes of average season attendance at Camden Yards.
In the two tables below, teams are sorted by highest to lowest average attendance within their league. Ballpark capacities are from the 2015 Ballpark Directory at Baseball Pilgrimages. To see the dates of each ballpark's highest and lowest single-game attendance, hover a mouse over any of those particular figures.
American League
34,856,983 tickets sold for 1,207 games in 15 ballparks (28,879 average)
| Team | Total | Dates | Average | High | Low | Ballpark (Capacity) |
| New York Yankees | 3,193,795 | 80 | 39,922 | 48,608 | 30,038 | Yankee Stadium (49,642) |
| Los Angeles Angels | 3,012,765 | 81 | 37,195 | 44,489 | 24,304 | Angel Stadium (45,050) |
| Boston Red Sox | 2,880,694 | 81 | 35,564 | 38,063 | 31,704 | Fenway Park (37,493) |
| Toronto Blue Jays | 2,794,891 | 81 | 34,505 | 48,414 | 14,184 | Rogers Centre (48,292) |
| Detroit Tigers | 2,726,048 | 81 | 33,655 | 45,030 | 25,932 | Comerica Park (41,681) |
| Kansas City Royals | 2,708,549 | 81 | 33,439 | 40,085 | 20,236 | Kauffman Stadium (37,903) |
| Texas Rangers | 2,491,875 | 81 | 30,764 | 48,885 | 17,884 | Globe Life Park (48,114) |
| Baltimore Orioles | 2,281,202 | 75 | 30,416 | 46,289 | 15,963 | Camden Yards (45,971) |
| Minnesota Twins | 2,220,054 | 81 | 27,408 | 40,660 | 17,449 | Target Field (39,504) |
| Seattle Mariners | 2,193,581 | 81 | 27,081 | 45,909 | 13,389 | Safeco Field (47,116) |
| Houston Astros | 2,153,585 | 81 | 26,587 | 43,753 | 15,777 | Minute Maid Park (40,963) |
| Chicago White Sox | 1,755,810 | 80 | 21,948 | 39,579 | 11,667 | U.S. Cellular Field (40,615) |
| Oakland A's | 1,768,175 | 81 | 21,829 | 36,067 | 11,364 | O.co Coliseum (35,067) |
| Cleveland Indians | 1,388,905 | 78 | 17,806 | 35,789 | 9,668 | Progressive Field (35,400) |
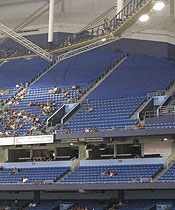
| Tampa Bay Rays | 1,247,668 | 81 | 15,403 | 31,042 | 8,701 | Tropicana Field (31,042) |
| Baltimore Orioles | 39,386 | 3 | 13,129 | 16,652 | 9,945 | Tropicana Field (31,042) |
National League
38,903,037 tickets sold for 1,210 games in 15 ballparks (32,151 average)
| Team | Total | Dates | Average | High | Low | Ballpark (Capacity) |
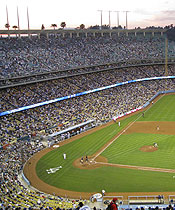
| Los Angeles Dodgers | 3,764,815 | 81 | 46,479 | 53,518 | 37,738 | Dodger Stadium (56,000) |
| St. Louis Cardinals | 3,520,889 | 81 | 43,468 | 47,875 | 40,052 | Busch Stadium (46,861) |
| San Francisco Giants | 3,375,882 | 81 | 41,678 | 42,743 | 41,025 | AT&T Park (41,503) |
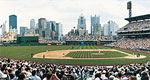
| Chicago Cubs | 2,959,812 | 81 | 36,541 | 41,688 | 26,390 | Wrigley Field (41,160) |
| Washington Nationals | 2,619,843 | 81 | 32,344 | 42,295 | 23,192 | Nationals Park (41,546) |
| New York Mets | 2,569,753 | 81 | 31,725 | 43,947 | 20,534 | Citi Field (41,922) |
| Milwaukee Brewers | 2,542,558 | 81 | 31,390 | 46,032 | 18,468 | Miller Park (43,000) |
| Colorado Rockies | 2,506,789 | 80 | 31,335 | 49,303 | 20,411 | Coors Field (50,398) |
| Pittsburgh Pirates | 2,498,596 | 81 | 30,847 | 39,933 | 11,777 | PNC Park (38,362) |
| San Diego Padres | 2,459,742 | 81 | 30,367 | 45,282 | 18,730 | Petco Park (42,445) |
| Cincinnati Reds | 2,419,506 | 81 | 29,870 | 43,633 | 15,616 | Great American Ball Park (42,271) |
| Arizona Diamondbacks | 2,080,145 | 81 | 25,681 | 49,043 | 15,857 | Chase Field (48,633) |
| Atlanta Braves | 2,001,392 | 80 | 25,017 | 49,243 | 12,595 | Turner Field (49,586) |
| Philadelphia Phillies | 1,831,080 | 78 | 23,475 | 45,549 | 13,238 | Citizens Bank Park (43,651) |
| Miami Marlins | 1,752,235 | 81 | 21,633 | 36,969 | 14,958 | Marlins Park (37,442) |
|
|
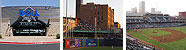
Two teams set a season-high attendance record at their present ballpark in 2015, while five set their all-time lows. The Royals were the year's biggest winners, as Kauffman Stadium was filled with more than two million fans for the first time since 1991 and the Royals' total draw in 2015 of 2,708,549 surpassed Kansas City's previous best attended season (1989) by 230,849 fans. The Pirates also had a record-setting season at PNC Park, besting the mark they had set there in 2014 by 56,032. The five ballparks that hosted the fewest fans in their existence were Citizens Bank Park, Progressive Field, Target Field, Turner Field and Yankee Stadium. The Phillies, at 592,772, had the biggest drop-off from their previous record low attendance total, and were followed by the Braves (326,173), Yankees (85,794), Twins (30,552) and Indians (2,739). |