 Baseball Pilgrimages Baseball Pilgrimages
The Best

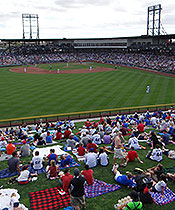
Sloan Park in Mesa, where the Cubs train, drew all-time spring training record crowds in 2016. The total of 226,163 was 3,748 more tickets sold than the record amount that the Cubs had set at the same ballpark in 2015, while the Cubs' per game home average (15,078) broke their '15 record by an even 250 fans.
As for the most crowded spring training ballpark in 2016, it was the dually used Salt River Fields, which reported 331,001 tickets sold to the 32 games hosted by its tenants, the Diamondbacks and Rockies.
The Worst

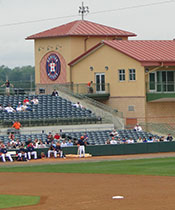
Osceola County Stadium, in its final season as the spring training home of the Astros, had the fewest tickets sold while the Astros' average game crowd of 4,239 there was easily (by 574) the worst average by a team in 2016.
Among the six two-team complexes, Roger Dean Stadium (Cardinals & Marlins) had the smallest total ticket sales (153,198 for 25 games) but Goodyear Ballpark had a per game average of just 5,138 for 31 Indians/Reds games, which was 990 lower than the typical draw at Jupiter's shared stadium.
|
|
|
The 30 major league teams that are evenly split between the Cactus and Grapefruit leagues had total ticket sales of 3,383,610 for 441 games in 2016.
Attendance figures are based on tickets sold for the games that were played between major league teams in the spring training ballparks in Arizona and Florida. There were 15 games rained out in 2016. The games that were played drew an average of 7,673.
All numbers are from Spring Training Connection and teams are sorted by highest to lowest average attendance within each league.
Cactus League
1,884,150 tickets sold by 15 teams for 228 games (8,264 average)
| Team | Total | Games | Average | High | Low | Ballpark (Capacity) |
| Chicago Cubs | 226,163 | 15 | 15,078 | 15,523 | 11,937 | Sloan Park (15,000) |
| Arizona Diamondbacks | 183,123 | 16 | 11,445 | 13,514 | 7,295 | Salt River Fields (11,000) |
| San Francisco Giants | 177,699 | 16 | 11,106 | 12,215 | 8,263 | Scottsdale Stadium (12,000) |
| Los Angeles Dodgers | 155,841 | 15 | 10,389 | 13,204 | 5,920 | Camelback Ranch (13,000) |
| Colorado Rockies | 147,878 | 16 | 9,242 | 13,236 | 6,147 | Salt River Fields (11,000) |
| Kansas City Royals | 126,108 | 15 | 8,407 | 11,781 | 4,554 | Surprise Stadium (10,500) |
| Seattle Mariners | 150,846 | 18 | 8,380 | 11,319 | 5,505 | Peoria Sports Complex (12,339) |
| Los Angeles Angels | 112,826 | 15 | 7,522 | 9,663 | 4,071 | Tempe Diablo Stadium (9,558) |
| Oakland A's | 100,614 | 15 | 6,708 | 10,112 | 3,535 | Hohokam Stadium (10,000) |
| Chicago White Sox | 89,829 | 14 | 6,416 | 13,203 | 3,373 | Camelback Ranch (13,000) |
| San Diego Padres | 89,265 | 14 | 6,376 | 11,080 | 3,829 | Peoria Sports Complex (12,339) |
| Texas Rangers | 86,437 | 14 | 6,174 | 8,915 | 3,598 | Surprise Stadium (10,500) |
| Milwaukee Brewers | 78,241 | 14 | 5,589 | 8,213 | 2,706 | Maryvale Baseball Park (10,000) |
| Cleveland Indians | 87,079 | 16 | 5,442 | 11,616 | 2,565 | Goodyear Ballpark (10,311) |
| Cincinnati Reds | 72,201 | 15 | 4,813 | 8,144 | 2,382 | Goodyear Ballpark (10,311) |
Grapefruit League
1,499,460 tickets sold by 15 teams for 213 games (7,040 average)
| Team | Total | Games | Average | High | Low | Ballpark (Capacity) |
| New York Yankees | 160,813 | 16 | 10,051 | 11,159 | 7,897 | Steinbrenner Field (11,076) |
| Boston Red Sox | 149,397 | 15 | 9,960 | 10,103 | 9,789 | JetBlue Park (10,823) |
| Minnesota Twins | 121,005 | 15 | 8,067 | 9,109 | 6,461 | Hammond Stadium (8,730) |
| Detroit Tigers | 116,061 | 15 | 7,737 | 9,074 | 6,133 | Joker Marchant Stadium (9,000) |
| Philadelphia Phillies | 112,781 | 15 | 7,519 | 11,222 | 4,018 | Bright House Field (8,500) |
| Baltimore Orioles | 119,029 | 16 | 7,439 | 8,518 | 5,441 | Ed Smith Stadium (8,500) |
| St. Louis Cardinals | 90,985 | 13 | 6,999 | 7,671 | 5,528 | Roger Dean Stadium (7,000) |
| Pittsburgh Pirates | 103,742 | 15 | 6,916 | 8,771 | 4,874 | McKechnie Field (8,500) |
| New York Mets | 96,552 | 14 | 6,897 | 7,710 | 5,924 | Tradition Field (7,160) |
| Atlanta Braves | 103,700 | 16 | 6,481 | 9,029 | 4,475 | Champion Stadium (9,500) |
| Washington Nationals | 71,085 | 12 | 5,924 | 7,718 | 4,065 | Space Coast Stadium (7,200) |
| Tampa Bay Rays | 68,566 | 13 | 5,274 | 6,876 | 3,158 | Charlotte Sports Park (6,823) |
| Toronto Blue Jays | 72,661 | 14 | 5,190 | 5,549 | 4,389 | FL Auto Exchange Stadium (5,509) |
| Miami Marlins | 62,213 | 12 | 5,184 | 7,489 | 3,234 | Roger Dean Stadium (7,000) |
| Houston Astros | 50,870 | 12 | 4,239 | 5,191 | 2,974 | Osceola County Stadium (5,300) |
|
|

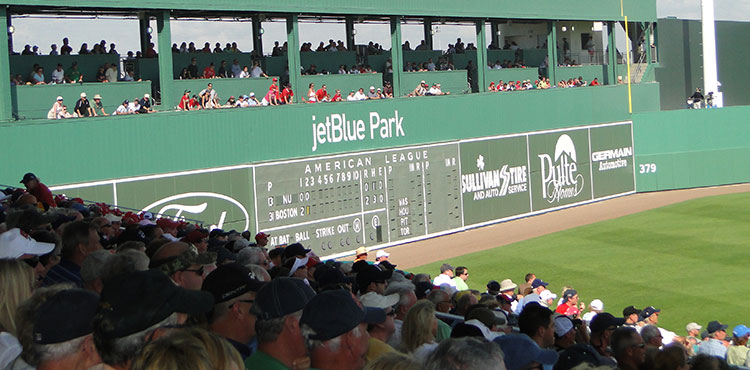
While not included in official spring training attendance, tickets are sold (although usually not at full prices) to the handful of exhibitions played between a major league team and what's usually a collegiate squad. For example, the Red Sox play an annual doubleheader against Boston College and Northeastern University to begin their spring training schedule at JetBlue Park, a DH that 7,737 attended in 2016, when a grand total of 31,120 attended 8 exhibitions in 7 spring training ballparks. |
|


