|
There were eight independent leagues that played full seasons in 2017, but three of them (Empire, Pecos, United Shore) did not publicly release attendance numbers. The five indy leagues that did had a combined 41 teams that collectively had tickets sales of 5,894,775 for 2,083 regular season game dates. Thus, the average announced crowd for them was 2,830.
Just like it is for affiliated minor league baseball teams, attendance figures for independent league teams are based on tickets sold and averages are computed based on dates, not games (the difference between the two is explained here).
Attendance totals and dates are from league websites, while ballpark information is from Baseball Pilgrimages' Ballpark Directory.
American Association
1,866,910 tickets sold by 11 teams for 562 games (3,322 average)
| Team | Total | Dates | Average | Ballpark (Capacity) |
| St. Paul Saints | 406,501 | 49 | 8,296 | CHS Field (7,210) |
| Winnipeg Goldeyes | 219,556 | 50 | 4,391 | Shaw Park (7,481) |
| Kansas City T-Bones | 211,599 | 52 | 4,069 | CommunityAmerica Ballpark (6,537) |
| Gary SouthShore RailCats | 181,612 | 50 | 3,632 | U.S. Steel Yard (6,139) |
| Fargo-Moorhead RedHawks | 176,086 | 49 | 3,594 | Newman Outdoor Field (4,513) |
| Lincoln Saltdogs | 172,712 | 51 | 3,387 | Haymarket Park (4,500) |
| Wichita Wingnuts | 157,995 | 51 | 3,098 | Lawrence-Dumont Stadium (6,111) |
| Sioux Falls Canaries | 113,506 | 49 | 2,316 | Sioux Falls Stadium (4,462) |
| Cleburne Railroaders | 103,264 | 58 | 1,780 | The Depot at Cleburne Station (5,000) |
| Sioux City Explorers | 58,407 | 47 | 1,243 | Lewis & Clark Park (3,630) |
| Texas AirHogs | 65,672 | 56 | 1,173 | AirHogs Stadium (5,445) |
Atlantic League
2,071,325 tickets sold by 8 teams for 525 games (3,945 average)
| Team | Total | Dates | Average | Ballpark (Capacity) |
| Somerset Patriots | 342,231 | 66 | 5,185 | TD Bank Ballpark (6,100) |
| Long Island Ducks | 341,830 | 67 | 5,102 | Bethpage Ballpark (6,002) |
| Sugar Land Skeeters | 317,721 | 68 | 4,672 | Constellation Field (7,500) |
| Lancaster Barnstormers | 255,251 | 68 | 3,754 | Clipper Magazine Stadium (6,000) |
| Southern Maryland Blue Crabs | 210,007 | 61 | 3,443 | Regency Furniture Stadium (6,000) |
| York Revolution | 212,624 | 66 | 3,222 | PeoplesBank Park (7,312) |
| New Britain Bees | 194,744 | 63 | 3,091 | New Britain Stadium (6,146) |
| Bridgeport Bluefish | 196,917 | 66 | 2,984 | The Ballpark at Harbor Yard (5,300) |
Can-Am League
631,144 tickets sold by 6 teams for 299 games (2,111 average)
| Team | Total | Dates | Average | Ballpark (Capacity) |
| Rockland Boulders | 145,005 | 51 | 2,843 | Palisades Credit Union Park (4,750) |
| Quebec Capitales | 141,923 | 50 | 2,838 | Stade CANAC (4,800) |
| Ottawa Champions | 92,654 | 47 | 1,971 | RCGT Park (10,332) |
| New Jersey Jackals | 91,892 | 52 | 1,767 | Yogi Berra Stadium (3,784) |
| Trois-Rivieres Aigles | 79,228 | 49 | 1,617 | Stade Stereo+ (4,500) |
| Sussex County Miners | 80,442 | 50 | 1,609 | Skylands Stadium (4,200) |
Frontier League
1,288,542 tickets sold by 12 teams for 543 games (2,373 average)
| Team | Total | Dates | Average | Ballpark (Capacity) |
| Schaumburg Boomers | 160,644 | 47 | 3,418 | Boomers Stadium (7,365) |
| Southern Illinois Miners | 151,521 | 46 | 3,294 | Rent One Park (4,500) |
| Gateway Grizzlies | 148,176 | 48 | 3,087 | GCS Ballpark (5,500) |
| Traverse City Beach Bums | 119,544 | 44 | 2,717 | Wuerfel Park (4,600) |
| Evansville Otters | 100,337 | 45 | 2,230 | Bosse Field (5,110) |
| Joliet Slammers | 100,160 | 45 | 2,226 | Slammers Stadium (6,229) |
| Florence Freedom | 87,545 | 42 | 2,084 | UC Health Stadium (4,200) |
| River City Rascals | 94,958 | 46 | 2,064 | CarShield Field (4,989) |
| Lake Erie Crushers | 94,035 | 47 | 2,001 | Sprenger Stadium (5,000) |
| Washington Wild Things | 77,233 | 41 | 1,884 | Wild Things Park (3,200) |
| Normal CornBelters | 75,804 | 45 | 1,685 | The Corn Crib (7,000) |
| Windy City ThunderBolts | 78,585 | 47 | 1,672 | Standard Bank Stadium (3,042) |
Pacific Association
36,854 tickets sold by 4 teams for 154 games (239 average)
| Team | Total | Dates | Average | Ballpark (Capacity) |
| San Rafael Pacifics | 18,236 | 38 | 480 | Albert Park (1,200) |
| Sonoma Stompers | 10,031 | 39 | 257 | People's Home Equity Ballpark (1,400) |
| Vallejo Admirals | 5,909 | 39 | 152 | Wilson Park (500) |
| Pittsburg Diamonds | 2,678 | 38 | 70 | Winter Chevrolet Stadium (400) |
|
|
Leagues With Attendance Not Announced
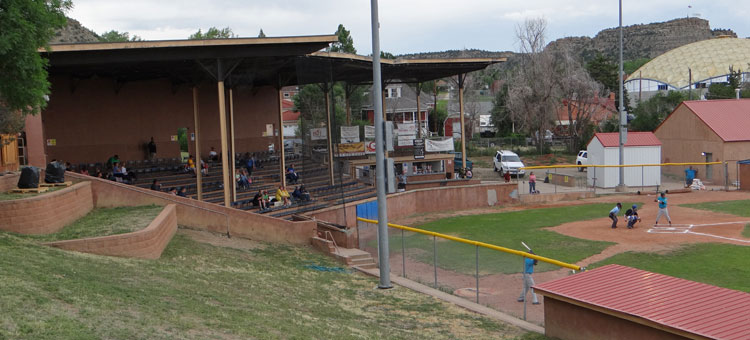
Central Park in Trinidad, Colorado is home to a Pecos League team that had an estimated attendance total of 5,518 in 2017
Not every independent league releases their official attendance figures publicly, so unaffiliated minor league attendance is actually higher than what's considered official for the independent leagues as a whole.
For 2017, there were three leagues that did not report attendance, at least not in a verified or precise form.
The Empire League, comprised of four teams, simply didn't release their attendance figures. The United Shore League, also consisting of four teams, and the 12-team Pecos League provided estimated attendance numbers.
For the United Shore League, it was estimated that attendance was 247,900 for 74 dates, all of which were held in the same ballpark in Utica, Michigan, where the average crowd at that venue, Jimmy John's Field, was 3,350.
Pecos League teams played an unequal number of home dates, as is league custom, in the various ballparks used by the league, which estimated actual attendance at 77,613 for 358 dates. The league office estimates are based on tickets used rather than sold, which makes the Pecos League the only minor league that attempts to report actual game attendance, which for them was 217 per date in 2017.
* The estimated attendance data for the Pecos and United Shore leagues are published on page 129 in the 2017 Attendance Analysis report written by David P. Kronheim, who goes by the "Number Tamer" moniker and provides his annual analysis of minor league baseball attendance at his website, which is numbertamer.com. |