 Baseball Pilgrimages Baseball Pilgrimages
Top Draws in 2017
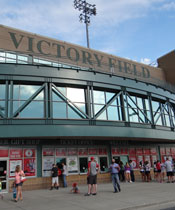
By averaging 9,159 fans per home date, the Indianapolis Indians at Victory Field were the top drawing team in all of minor league baseball. Indianapolis was also #1 in Triple-A, while the Frisco RoughRiders at Dr Pepper Ballpark averaged 6,812 to be the top drawing Double-A team. At the Single-A level, the Dayton Dragons' average of 8,038 at Fifth Third Field was easily the best for the classification. For short-season teams, the 6,303 average drawn by the Vancouver Canadians, the only minor league team located outside of the US, at Nat Bailey Stadium lead the way.
The Box Office Busts of 2017
The smallest typical crowd at a minor league ballpark was 517, which is what the Class A Buies Creek Astros averaged at Jim Perry Stadium, a collegiate venue that served its first of two seasons as the team's temporary home in 2017. For teams that play a short season of games, the Princeton Rays claimed the bottom spot by averaging 536 at Hunnicutt Field. At the Double-A classification, the Mobile BayBears, with 1,498 at Hank Aaron Stadium, had the worst average. The smallest average crowd at the Triple-A level was the 3,135 of the Gwinnett Braves at Coolray Field.
Being Average
The average number of tickets sold per minor league game in 2017 was 4,024. The closest a team came to that number was the Hudson Valley Renegades, who averaged 3,998 at Dutchess Stadium.
24 Got 'Em All In
Depending on league and level, teams have between 34 and 71 home games scheduled per season. Here's the games-by-league breakdown, with the teams listed in brackets having made it through their 2017 season with no home postponements, and thus no lost gates:
71 games
International, Pacific Coast
[Durham, Las Vegas, Reno]
70 games
California, Carolina, Eastern, Florida State, Midwest, South Atlantic, Southern, Texas
[Cedar Rapids, Inland Empire, Lancaster, Modesto, Quad Cities, Rancho Cucamonga, Visalia]
38 games
New York-Penn, Northwest, Pioneer
[Billings, Boise, Eugene, Everett, Great Falls, Helena, Hillsboro, Idaho Falls, Missoula, Ogden, Salem-Keizer, State College, Tri-City (WA), Vancouver]
34 games
Appalachian
[none]
Games/Gates Lost
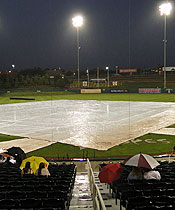
There were 40 teams that lost at least 5 dates due to weather, most often rain, or other circumstances. In that regard, the most unfortunate team in 2017 was the Florida Fire Frogs, who lost 17 dates at Osceola County Stadium. Overall, 136 teams suffered at least one cancellation at their home ballpark.
When added up, there were 518 cancelled dates by minor league baseball's 160 teams, which had a collective 9,910 regular season games scheduled in 2017. So that means attendance was counted for 9,392 dates at ballparks used by minor league teams.
|
|
|
Regular season attendance for the 160 teams playing in the 14 minor leagues affiliated with major league baseball and based in the USA was 37,789,759 in 2017, when there were 9,392 game dates.
Listed on this page by league are the home attendance figures for all teams, which are sorted by highest to lowest average attendance within their respective leagues. As has long been custom, the numbers are based on tickets sold, so no-shows (unused tickets) are included in a team's attendance total and average.
Note that due to weather, not all teams have the same amount of home "dates," a category that is used instead of "games" since most teams are forced to play a varying number of single-admission doubleheaders to make up for games postponed by rain, etc. Doubleheaders count as one date because one ticket is sold for both games. Hence the number of dates, which is what average attendance is based on, is usually less than the number of home games played. In 2017 just 15% of teams had no postponements at home, and for only those 24 teams did dates equal games played.
All attendance totals and dates are from league websites. Ballpark information is from the Baseball Pilgrimages-compiled Ballpark Directory.
Triple-A
International League
6,671,670 tickets sold by 14 teams for 942 games (7,082 average)
| Team | Total | Dates | Average | Ballpark (Capacity) |
| Indianapolis Indians | 641,141 | 70 | 9,159 | Victory Field (14,230) |
| Charlotte Knights | 628,526 | 69 | 9,109 | BB&T Ballpark (10,200) |
| Columbus Clippers | 616,059 | 68 | 9,060 | Huntington Park (10,100) |
| Lehigh Valley IronPigs | 555,146 | 65 | 8,541 | Coca-Cola Park (10,100) |
| Buffalo Bisons | 526,574 | 65 | 8,101 | Coca-Cola Field (17,600) |
| Durham Bulls | 547,841 | 71 | 7,716 | Durham Bulls Athletic Park (10,000) |
| Toledo Mud Hens | 533,014 | 70 | 7,614 | Fifth Third Field (8,943) |
| Louisville Bats | 467,024 | 68 | 6,868 | Louisville Slugger Field (13,131) |
| Rochester Red Wings | 445,581 | 68 | 6,553 | Frontier Field (10,840) |
| Scranton/WB RailRiders | 439,412 | 68 | 6,462 | PNC Field (10,000) |
| Pawtucket Red Sox | 409,960 | 64 | 6,406 | McCoy Stadium (10,031) |
| Norfolk Tides | 359,263 | 66 | 5,443 | Harbor Park (11,856) |
| Syracuse Chiefs | 292,054 | 63 | 4,636 | NBT Bank Stadium (11,117) |
| Gwinnett Braves | 210,075 | 67 | 3,135 | Coolray Field (10,427) |
Pacific Coast League
7,150,468 tickets sold by 16 teams for 1,093 games (6,542 average)
| Team | Total | Dates | Average | Ballpark (Capacity) |
| Nashville Sounds | 593,679 | 67 | 8,861 | First Tennessee Park (10,000) |
| Round Rock Express | 610,681 | 70 | 8,724 | Dell Diamond (10,000) |
| Sacramento River Cats | 562,237 | 70 | 8,032 | Raley Field (14,680) |
| Albuquerque Isotopes | 542,502 | 68 | 7,978 | Isotopes Park (13,279) |
| El Paso Chihuahuas | 544,668 | 69 | 7,894 | Southwest University Park (9,500) |
| Iowa Cubs | 535,660 | 69 | 7,763 | Principal Park (11,500) |
| Salt Lake Bees | 483,202 | 70 | 6,903 | Smith's Ballpark (15,334) |
| Oklahoma City Dodgers | 444,224 | 68 | 6,533 | Chickasaw Bricktown Ballpark (9,000) |
| Fresno Grizzlies | 428,341 | 69 | 6,208 | Chukchansi Park (12,500) |
| New Orleans Baby Cakes | 349,883 | 63 | 5,554 | Shrine on Airline (10,000) |
| Tacoma Rainiers | 374,951 | 69 | 5,434 | Cheney Stadium (9,600) |
| Omaha Storm Chasers | 358,777 | 67 | 5,355 | Werner Park (9,023) |
| Memphis Redbirds | 350,007 | 69 | 5,073 | AutoZone Park (10,000) |
| Las Vegas 51s | 359,059 | 71 | 5,057 | Cashman Field (9,334) |
| Reno Aces | 347,502 | 71 | 4,894 | Greater Nevada Field (9,013) |
| Colorado Springs Sky Sox | 265,095 | 63 | 4,208 | Security Service Field (8,400) |
Double-A
Eastern League
3,723,010 tickets sold by 12 teams for 780 games (4,773 average)
| Team | Total | Dates | Average | Ballpark (Capacity) |
| Reading Fightin Phils | 411,698 | 68 | 6,054 | FirstEnergy Stadium (9,000) |
| Richmond Flying Squirrels | 386,185 | 64 | 6,034 | The Diamond (9,560) |
| Hartford Yard Goats | 395,196 | 68 | 5,812 | Dunkin' Donuts Park (8,000) |
| Portland Sea Dogs | 356,153 | 63 | 5,653 | Hadlock Field (7,368) |
| Akron RubberDucks | 343,351 | 66 | 5,202 | Canal Park (9,447) |
| Trenton Thunder | 349,013 | 68 | 5,133 | Arm & Hammer Park (6,341) |
| New Hampshire Fisher Cats | 284,108 | 60 | 4,735 | Northeast Delta Dental Stadium (7,000) |
| Altoona Curve | 294,486 | 67 | 4,395 | Peoples Natural Gas Field (7,210) |
| Harrisburg Senators | 262,872 | 66 | 3,983 | FNB Field (6,300) |
| Bowie Baysox | 234,789 | 68 | 3,453 | Prince George's Stadium (10,000) |
| Erie SeaWolves | 214,394 | 64 | 3,350 | UPMC Park (6,000) |
| Binghamton Rumble Ponies | 190,765 | 58 | 3,289 | NYSEG Stadium (6,012) |
Southern League
2,339,085 tickets sold by 10 teams for 655 games (3,571 average)
| Team | Total | Dates | Average | Ballpark (Capacity) |
| Birmingham Barons | 391,725 | 66 | 5,935 | Regions Field (8,500) |
| Jacksonville Jumbo Shrimp | 325,743 | 63 | 5,171 | Baseball Grounds
of Jacksonville (11,000) |
| Tennessee Smokies | 313,796 | 63 | 4,981 | Smokies Stadium (6,000) |
| Pensacola Blue Wahoos | 298,108 | 69 | 4,320 | Blue Wahoos Stadium (5,038) |
| Montgomery Biscuits | 228,376 | 67 | 3,409 | Riverwalk Stadium (7,000) |
| Chattanooga Lookouts | 209,948 | 66 | 3,181 | AT&T Field (6,362) |
| Mississippi Braves | 190,645 | 66 | 2,889 | Trustmark Park (8,480) |
| Biloxi Shuckers | 167,151 | 65 | 2,572 | MGM Park (6,076) |
| Jackson Generals | 120,695 | 68 | 1,775 | The Ballpark at Jackson (6,000) |
| Mobile BayBears | 92,898 | 62 | 1,498 | Hank Aaron Stadium (6,000) |
Texas League
2,727,350 tickets sold by 8 teams for 540 games (5,051 average)
| Team | Total | Dates | Average | Ballpark (Capacity) |
| Frisco RoughRiders | 470,003 | 69 | 6,812 | Dr Pepper Ballpark (10,000) |
| Tulsa Drillers | 374,976 | 67 | 5,597 | ONEOK Field (7,833) |
| Arkansas Travelers | 328,347 | 66 | 4,975 | Dickey-Stephens Park (7,000) |
| Corpus Christi Hooks | 331,242 | 67 | 4,944 | Whataburger Field (7,500) |
| Springfield Cardinals | 331,259 | 69 | 4,801 | Hammons Field (6,750) |
| San Antonio Missions | 305,351 | 67 | 4,557 | Wolff Stadium (6,200) |
| Northwest Arkansas Naturals | 304,026 | 68 | 4,471 | Arvest Ballpark (6,500) |
| Midland RockHounds | 282,146 | 67 | 4,211 | Security Bank Ballpark (6,669) |
Class A
California League
1,364,374 tickets sold by 8 teams for 557 games (2,450 average)
| Team | Total | Dates | Average | Ballpark (Capacity) |
| Lake Elsinore Storm | 199,661 | 69 | 2,894 | Lake Elsinore Diamond (7,866) |
| Inland Empire 66ers | 202,336 | 70 | 2,891 | San Manuel Stadium (5,000) |
| Stockton Ports | 184,164 | 69 | 2,669 | Banner Island Ballpark (5,200) |
| Rancho Cucamonga Quakes | 171,622 | 70 | 2,452 | LoanMart Field (6,615) |
| Lancaster JetHawks | 169,237 | 70 | 2,418 | The Hangar (4,500) |
| San Jose Giants | 163,373 | 69 | 2,368 | Municipal Stadium (5,208) |
| Modesto Nuts | 147,562 | 70 | 2,108 | John Thurman Field (4,000) |
| Visalia Rawhide | 126,419 | 70 | 1,806 | Recreation Park (2,468) |
Carolina League
2,027,878 tickets sold by 10 teams for 648 games (3,129 average)
| Team | Total | Dates | Average | Ballpark (Capacity) |
| Frederick Keys | 303,930 | 63 | 4,824 | Harry Grove Stadium (5,400) |
| Winston-Salem Dash | 304,607 | 69 | 4,415 | BB&T Ballpark (5,500) |
| Potomac Nationals | 236,010 | 61 | 3,869 | Pfitzner Stadium (6,000) |
| Wilmington Blue Rocks | 230,677 | 60 | 3,845 | Frawley Stadium (6,532) |
| Myrtle Beach Pelicans | 233,126 | 65 | 3,587 | TicketReturn.com Field (5,200) |
| Salem Red Sox | 215,244 | 65 | 3,311 | Haley Toyota Field (6,300) |
| Carolina Mudcats | 190,420 | 68 | 2,800 | Five County Stadium (6,500) |
| Lynchburg Hillcats | 137,566 | 66 | 2,084 | City Stadium (4,281) |
| Down East Wood Ducks | 145,780 | 72 | 2,025 | Grainger Stadium (4,100) |
| Buies Creek Astros | 30,518 | 59 | 517 | Jim Perry Stadium (2,000) |
Florida State League
1,160,428 tickets sold by 12 teams for 763 games (1,521 average)
| Team | Total | Dates | Average | Ballpark (Capacity) |
| Clearwater Threshers | 200,201 | 67 | 2,988 | Spectrum Field (8,500) |
| Daytona Tortugas | 136,224 | 66 | 2,064 | Jackie Robinson Ballpark (4,000) |
| Fort Myers Miracle | 121,438 | 60 | 2,024 | Hammond Stadium (8,730) |
| St. Lucie Mets | 132,359 | 66 | 2,005 | First Data Field (7,160) |
| Charlotte Stone Crabs | 120,685 | 63 | 1,916 | Charlotte Sports Park (6,823) |
| Tampa Yankees | 93,823 | 66 | 1,422 | Steinbrenner Field (11,076) |
| Bradenton Marauders | 79,331 | 61 | 1,301 | LECOM Park (8,500) |
| Florida Fire Frogs | 57,324 | 53 | 1,082 | Osceola County Stadium (5,300) |
| Jupiter Hammerheads | 69,064 | 66 | 1,046 | Roger Dean Stadium (7,000) |
| Palm Beach Cardinals | 58,832 | 63 | 934 | Roger Dean Stadium (7,000) |
| Lakeland Flying Tigers | 52,191 | 64 | 815 | Joker Marchant Stadium (9,000) |
| Dunedin Blue Jays | 38,956 | 68 | 573 | Florida Auto Exchange
Stadium (5,509) |
Midwest League
4,087,373 tickets sold by 16 teams for 1,076 games (3,799 average)
| Team | Total | Dates | Average | Ballpark (Capacity) |
| Dayton Dragons | 554,638 | 69 | 8,038 | Fifth Third Field (7,230) |
| Fort Wayne TinCaps | 409,253 | 69 | 5,931 | Parkview Field (8,100) |
| Kane County Cougars | 394,567 | 67 | 5,889 | Northwestern Medicine Field (7,400) |
| West Michigan Whitecaps | 383,983 | 69 | 5,565 | Fifth Third Ballpark (9,684) |
| South Bend Cubs | 354,070 | 67 | 5,285 | Four Winds Field (5,000) |
| Lansing Lugnuts | 303,843 | 68 | 4,468 | Cooley Law School Stadium (11,000) |
| Wisconsin Timber Rattlers | 230,326 | 67 | 3,438 | Fox Cities Stadium (5,900) |
| Quad Cities River Bandits | 230,006 | 70 | 3,286 | Modern Woodmen Park (4,024) |
| Lake County Captains | 212,747 | 66 | 3,223 | Classic Park (7,273) |
| Peoria Chiefs | 212,659 | 67 | 3,174 | Dozer Park (7,500) |
| Great Lakes Loons | 202,433 | 67 | 3,021 | Dow Diamond (5,200) |
| Bowling Green Hot Rods | 179,839 | 63 | 2,855 | Bowling Green Ballpark (4,559) |
| Cedar Rapids Kernels | 166,427 | 70 | 2,378 | Veterans Memorial Stadium (5,300) |
| Clinton LumberKings | 121,302 | 66 | 1,838 | Ashford University Field (4,000) |
| Burlington Bees | 67,044 | 64 | 1,048 | Community Field (3,200) |
| Beloit Snappers | 64,236 | 67 | 959 | Pohlman Field (3,500) |
South Atlantic League
3,073,435 tickets sold by 14 teams for 917 games (3,352 average)
| Team | Total | Dates | Average | Ballpark (Capacity) |
| Greensboro Grasshoppers | 350,743 | 67 | 5,235 | First National Bank Field (7,499) |
| Lakewood BlueClaws | 338,544 | 65 | 5,208 | FirstEnergy Park (6,588) |
| Greenville Drive | 328,222 | 67 | 4,899 | Fluor Field (5,700) |
| Columbia Fireflies | 315,034 | 66 | 4,773 | Spirit Communications Park (8,000) |
| Charleston RiverDogs | 305,622 | 68 | 4,494 | Riley Park (5,800) |
| Lexington Legends | 281,210 | 65 | 4,326 | Whitaker Bank Ballpark (6,994) |
| Delmarva Shorebirds | 207,131 | 64 | 3,236 | Perdue Stadium (5,200) |
| Augusta GreenJackets | 178,269 | 65 | 2,743 | Lake Olmstead Stadium (4,322) |
| Asheville Tourists | 184,019 | 68 | 2,706 | McCormick Field (4,000) |
| Rome Braves | 161,444 | 68 | 2,374 | State Mutual Stadium (5,100) |
| Hickory Crawdads | 136,225 | 64 | 2,129 | L.P. Frans Stadium (5,062) |
| West Virginia Power | 133,679 | 65 | 2,057 | Appalachian Power Park (4,500) |
| Hagerstown Suns | 84,181 | 61 | 1,380 | Municipal Stadium (4,600) |
| Kannapolis Intimidators | 69,112 | 64 | 1,080 | Intimidators Stadium (4,700) |
Short Season/Rookie
Appalachian League
354,090 tickets sold by 10 teams for 321 games (1,103 average)
| Team | Total | Dates | Average | Ballpark (Capacity) |
| Pulaski Yankees | 77,880 | 33 | 2,360 | Calfee Park (2,500) |
| Johnson City Cardinals | 65,202 | 33 | 1,976 | TVA Credit Union Ballpark (2,500) |
| Greeneville Astros | 35,305 | 31 | 1,139 | Pioneer Park (3,572) |
| Danville Braves | 32,634 | 31 | 1,053 | Legion Field (2,588) |
| Burlington Royals | 34,483 | 33 | 1,045 | Burlington Athletic Stadium (3,500) |
| Kingsport Mets | 29,742 | 33 | 901 | Hunter Wright Stadium (2,500) |
| Bluefield Blue Jays | 21,595 | 31 | 697 | Bowen Field (2,250) |
| Bristol Pirates | 20,813 | 31 | 671 | DeVault Memorial Stadium (2,000) |
| Elizabethton Twins | 18,746 | 32 | 586 | Joe O'Brien Field (1,500) |
| Princeton Rays | 17,690 | 33 | 536 | Hunnicutt Field (1,950) |
New York-Penn League
1,403,575 tickets sold by 14 teams for 495 games (2,836 average)
| Team | Total | Dates | Average | Ballpark (Capacity) |
| Brooklyn Cyclones | 186,853 | 36 | 5,190 | MCU Park (7,500) |
| Tri-City ValleyCats | 142,922 | 35 | 4,083 | Bruno Stadium (5,000) |
| Hudson Valley Renegades | 147,936 | 37 | 3,998 | Dutchess Stadium (4,494) |
| Aberdeen IronBirds | 130,823 | 33 | 3,964 | Ripken Stadium (6,300) |
| Lowell Spinners | 126,565 | 36 | 3,516 | LeLacheur Park (5,000) |
| State College Spikes | 123,401 | 38 | 3,247 | Medlar Field at Lubrano Park (5,570) |
| Mahoning Valley Scrappers | 107,894 | 36 | 2,997 | Eastwood Field (6,000) |
| Vermont Lake Monsters | 82,674 | 35 | 2,362 | Centennial Field (4,415) |
| Connecticut Tigers | 73,439 | 33 | 2,225 | Dodd Stadium (6,270) |
| Staten Island Yankees | 71,401 | 35 | 2,040 | Richmond County Bank Ballpark (7,171) |
| West Virginia Black Bears | 75,064 | 37 | 2,029 | Monongalia County Ballpark (2,500) |
| Williamsport Crosscutters | 61,082 | 34 | 1,797 | Bowman Field (2,474) |
| Auburn Doubledays | 46,132 | 36 | 1,281 | Falcon Park (2,800) |
| Batavia Muckdogs | 27,389 | 34 | 806 | Dwyer Stadium (2,600) |
Northwest League
1,088,981 tickets sold by 8 teams for 303 games (3,594 average)
| Team | Total | Dates | Average | Ballpark (Capacity) |
| Vancouver Canadians | 239,527 | 38 | 6,303 | Nat Bailey Stadium (6,500) |
| Spokane Indians | 196,653 | 37 | 5,315 | Avista Stadium (7,162) |
| Hillsboro Hops | 128,416 | 38 | 3,379 | Ron Tonkin Field (4,500) |
| Eugene Emeralds | 125,297 | 38 | 3,297 | PK Park (4,000) |
| Boise Hawks | 121,455 | 38 | 3,196 | Memorial Stadium (3,426) |
| Everett AquaSox | 110,161 | 38 | 2,899 | Everett Memorial Stadium (3,682) |
| Tri-City Dust Devils | 86,461 | 38 | 2,275 | Gesa Stadium (3,700) |
| Salem-Keizer Volcanoes | 81,011 | 38 | 2,132 | Volcanoes Stadium (4,252) |
Pioneer League
618,042 tickets sold by 8 teams for 302 games (2,046 average)
| Team | Total | Dates | Average | Ballpark (Capacity) |
| Ogden Raptors | 128,348 | 38 | 3,378 | Lindquist Field (6,700) |
| Billings Mustangs | 110,311 | 38 | 2,903 | Dehler Park (3,071) |
| Idaho Falls Chukars | 90,816 | 38 | 2,390 | Melaleuca Field (3,400) |
| Grand Junction Rockies | 79,547 | 37 | 2,150 | Suplizio Field (7,014) |
| Missoula Osprey | 71,936 | 38 | 1,893 | Ogren Park Allegiance Field (3,500) |
| Orem Owlz | 55,981 | 37 | 1,513 | Home of the Owlz (4,500) |
| Great Falls Voyagers | 47,260 | 38 | 1,244 | Centene Stadium (3,200) |
| Helena Brewers | 33,843 | 38 | 891 | Kindrick Legion Field (2,100) |
|
|
Home Away From Home
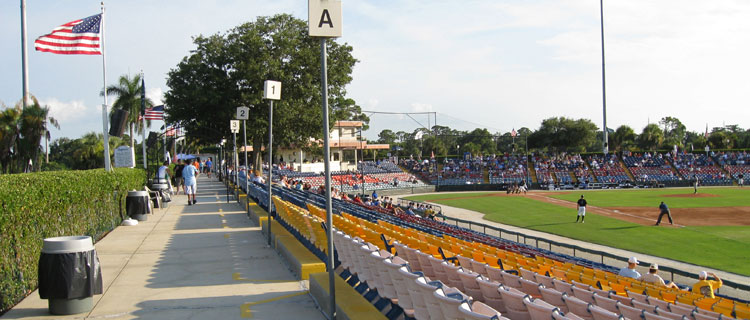
Holman Stadium at "Historic Dodgertown" in Vero Beach has been home to an annual minor league game since 2014
Most teams play all of their home games in one ballpark, but there are annual and yearly exceptions.
For example, in 2017 the 4th annual "Jackie Robinson Celebration Game" was played at Holman Stadium in Vero Beach, FL, with the St. Lucie Mets getting to be the home team against the also visiting Florida Fire Frogs at the Dodgers' former longtime spring training site. The game had an attendance of 6,849.
Tickets sold for such "special occasion" games contribute to a team's overall home attendance figures, so St. Lucie's season totals at their normal home park, First Data Field, included the one game they hosted at Historic Dodgertown.
|
|