|
Mets attendance in the Citi Field era is documented on this page.
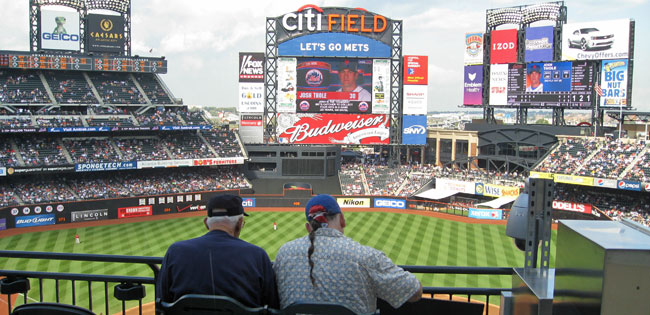
Citi Field opened in 2009 with an official capacity of 41,800 and has seated 41,922 since 2012.
Note that all attendance numbers are based on tickets sold, not tickets actually used, and the yearly averages are computed by using dates instead of games, as single-admission doubleheaders count as only one date for attendance purposes.
Yearly (season) totals and averages plus individual game records are based on regular season attendance. Postseason attendance is tallied separately.
Yearly Attendance
17,176,964 tickets sold for 559 dates over 7 years (30,728 average)
| Year | Total | Dates | DH | Average | High | Low | Opener | Capacity |
| 2015 | 2,569,753 | 81 | 0 | 31,725 | 43,947 | 20,534 | 43,947 | 41,922 |
| 2014 | 2,148,808 | 80 | 1 | 26,860 | 42,442 | 20,170 | 42,442 | 41,922 |
| 2013 | 2,135,657 | 80 | 1 | 26,696 | 41,891 | 20,147 | 41,053 | 41,922 |
| 2012 | 2,242,803 | 80 | 1 | 28,035 | 42,516 | 20,010 | 42,080 | 41,922 |
| 2011 | 2,352,596 | 78 | 3 | 30,161 | 42,042 | 21,015 | 41,075 | 41,800 |
| 2010 | 2,573,077 | 79 | 2 | 32,571 | 41,422 | 24,384 | 41,245 | 41,800 |
| 2009 | 3,154,270 | 81 | 0 | 38,942 | 41,315 | 35,581 | 41,007 | 41,800 |
10 Largest Crowds
| Rank | Crowd | Date | Day | Opponent | Notes |
| 1. | 43,947 | April 13, 2015 | Monday | Phillies | home opener |
| 2. | 43,630 | September 19, 2015 | Saturday | Yankees | largest interleague crowd |
| 3. | 43,602 | September 18, 2015 | Friday | Yankees | |
| 4. | 43,571 | September 20, 2015 | Sunday | Yankees | |
| 5. | 43,255 | August 29, 2015 | Saturday | Red Sox | |
| 6. | 42,996 | August 1, 2015 | Saturday | Nationals | Yoenis Cespedes debut |
| 7. | 42,516 | July 3, 2012 | Tuesday | Phillies | fireworks night |
| 8. | 42,442 | March 31, 2014 | Monday | Nationals | opening day |
| 9. | 42,364 | June 24, 2012 | Sunday | Yankees | |
| 10. | 42,122 | June 23, 2012 | Saturday | Yankees | |
10 Smallest Crowds
| Rank | Crowd | Date | Day | Opponent |
| 1. | 20,010 | September 20, 2012 | Thursday | Phillies |
| 2. | 20,061 | May 14, 2012 | Monday | Brewers |
| 3. | 20,147 | May 9, 2013 | Thursday | Pirates |
| 4. | 20,151 | September 11, 2013 | Wednesday | Nationals |
| 5. | 20,170 | June 11, 2014 | Wednesday | Brewers |
| 6. | 20,174 | September 9, 2013 | Monday | Nationals |
| 7. | 20,192 | April 24, 2012 | Tuesday | Marlins |
| 8. | 20,206 | June 10, 2014 | Tuesday | Brewers |
| 9. | 20,220 | April 22, 2014 | Tuesday | Cardinals |
| 10. | 20,263 | May 27, 2014 | Tuesday | Pirates |
Monday Highs
| Rank | Crowd | Date | Opponent |
| 1. | 43,947 | April 13, 2015 | Phillies |
| 2. | 42,442 | March 31, 2014 | Nationals |
| 3. | 41,245 | April 5, 2010 | Marlins |
| 4. | 41,103 | May 25, 2009 | Nationals |
| 5. | 41,053 | April 1, 2013 | Padres |
|
Monday Lows
| Rank | Crowd | Date | Opponent |
| 1. | 20,061 | May 14, 2012 | Brewers |
| 2. | 20,174 | September 9, 2013 | Nationals |
| 3. | 20,382 | April 21, 2014 | Cardinals |
| 4. | 20,527 | September 17, 2012 | Phillies |
| 5. | 20,836 | July 7, 2014 | Braves |
|
Tuesday Highs
| Rank | Crowd | Date | Opponent |
| 1. | 42,516 | July 3, 2012 | Phillies |
| 2. | 40,354 | August 4, 2009 | Cardinals |
| 3. | 39,636 | July 7, 2009 | Dodgers |
| 4. | 39,489 | April 14, 2015 | Phillies |
| 5. | 39,408 | May 12, 2009 | Braves |
|
Tuesday Lows
| Rank | Crowd | Date | Opponent |
| 1. | 20,192 | April 24, 2012 | Marlins |
| 2. | 20,206 | June 10, 2014 | Brewers |
| 3. | 20,220 | April 22, 2014 | Cardinals |
| 4. | 20,263 | May 27, 2014 | Pirates |
| 5. | 20,307 | September 10, 2013 | Nationals |
|
Wednesday Highs
| Rank | Crowd | Date | Opponent |
| 1. | 41,257 | July 3, 2013 | D-backs |
| 2. | 40,555 | May 13, 2009 | Braves |
| 3. | 40,171 | May 27, 2009 | Nationals |
| 4. | 40,027 | July 8, 2009 | Dodgers |
| 5. | 39,781 | August 5, 2009 | Cardinals |
|
Wednesday Lows
| Rank | Crowd | Date | Opponent |
| 1. | 20,151 | September 11, 2013 | Nationals |
| 2. | 20,170 | June 11, 2014 | Brewers |
| 3. | 20,623 | April 25, 2012 | Marlins |
| 4. | 20,971 | April 22, 2015 | Braves |
| 5. | 21,052 | April 15, 2015 | Phillies |
|
Thursday Highs
| Rank | Crowd | Date | Opponent |
| 1. | 42,080 | April 5, 2012 | Braves |
| 2. | 41,221 | June 25, 2009 | Cardinals |
| 3. | 40,133 | May 15, 2014 | Yankees |
| 4. | 40,087 | July 29, 2010 | Cardinals |
| 5. | 40,024 | July 30, 2009 | Rockies |
|
Thursday Lows
| Rank | Crowd | Date | Opponent |
| 1. | 20,010 | September 20, 2012 | Phillies |
| 2. | 20,147 | May 9, 2013 | Pirates |
| 3. | 20,484 | September 12, 2013 | Nationals |
| 4. | 20,556 | April 16, 2015 | Marlins |
| 5. | 20,561 | April 3, 2014 | Nationals |
|
Friday Highs
| Rank | Crowd | Date | Opponent |
| 1. | 43,602 | September 18, 2015 | Yankees |
| 2. | 42,020 | July 1, 2011 | Yankees |
| 3. | 41,382 | May 21, 2010 | Yankees |
| 4. | 41,278 | June 26, 2009 | Yankees |
| 5. | 41,075 | April 8, 2011 | Nationals |
|
Friday Lows
| Rank | Crowd | Date | Opponent |
| 1. | 20,562 | September 13, 2013 | Marlins |
| 2. | 21,171 | April 25, 2014 | Marlins |
| 3. | 21,582 | April 26, 2013 | Phillies |
| 4. | 22,736 | August 26, 2011 | Braves |
| 5. | 24,071 | September 7, 2012 | Braves |
|
Saturday Highs
| Rank | Crowd | Date | Opponent |
| 1. | 43,630 | September 19, 2015 | Yankees |
| 2. | 43,255 | August 29, 2015 | Red Sox |
| 3. | 42,996 | August 1, 2015 | Nationals |
| 4. | 42,122 | June 23, 2012 | Yankees |
| 5. | 42,042 | July 2, 2011 | Yankees |
|
Saturday Lows
| Rank | Crowd | Date | Opponent |
| 1. | 20,338 | June 8, 2013 | Marlins |
| 2. | 21,492 | April 26, 2014 | Marlins |
| 3. | 24,325 | April 20, 2013 | Nationals |
| 4. | 24,418 | July 5, 2014 | Rangers |
| 5. | 24,551 | May 24, 2014 | D-backs |
|
Sunday Highs
| Rank | Crowd | Date | Opponent |
| 1. | 43,571 | September 20, 2015 | Yankees |
| 2. | 42,364 | June 24, 2012 | Yankees |
| 3. | 41,891 | September 29, 2013 | Brewers |
| 4. | 41,631 | October 4, 2015 | Nationals |
| 5. | 41,513 | July 3, 2011 | Yankees |
|
Sunday Lows
| Rank | Crowd | Date | Opponent |
| 1. | 21,015 | June 5, 2011 | Braves |
| 2. | 21,747 | June 9, 2013 | Marlins |
| 3. | 22,232 | April 24, 2011 | D-backs |
| 4. | 23,161 | September 9, 2012 | Braves |
| 5. | 23,559 | June 3, 2012 | Cardinals |
|
Playoff Attendance
311,703 tickets sold for 7 games (44,529 average)
| Rank | Crowd | Date | Day | Opponent | Game |
| 1. | 44,859 | November 1, 2015 | Sunday | Royals | World Series Game 5 |
| 2. | 44,815 | October 31, 2015 | Saturday | Royals | World Series Game 4 |
| 3. | 44,781 | October 30, 2015 | Friday | Royals | World Series Game 3 |
| 4. | 44,502 | October 18, 2015 | Sunday | Cubs | NLCS Game 2 |
| 5. | 44,287 | October 17, 2015 | Saturday | Cubs | NLCS Game 1 |
| 6. | 44,276 | October 12, 2015 | Monday | Dodgers | NLDS Game 3 |
| 7. | 44,183 | October 13, 2015 | Tuesday | Dodgers | NLDS Game 4 |
|
Citi Field Attendance Facts & Feats
13 times the Mets have played in front of crowds that exceeded Citi Field's listed capacity. Of those 13 games, 7 were against the Yankees. In the ballpark's seven-season history, 6 of the 13 overflow crowds were drawn in 2015.
The Mets have averaged 3,629 more fans per game against American League opponents (33,948) than they have against National League teams (30,319). From 2009-2015, the Mets played 63 interleague games against 13 AL teams during the regular season at Citi Field; the Cleveland Indians and Seattle Mariners are the only teams yet to play there. The Yankees have made the most interleague visits to the Mets' ballpark and the 19 games played between the crosstown rivals have averaged 40,505.
There have been 8 single-admission doubleheaders. The average attendance for them is 27,646.
The largest crowd for any major league game in Citi Field history is 45,186. That was the attendance for the 2013 All-Star Game, which was played on July 16, 2013.
|
|
|